Updated on 2022-03-09 by Adam Hardy
Does going vegan reduce people’s personal carbon footprints, and if so, by how much? It should be obvious, but with the way agriculture and supply chains work today, the only way to know for sure is to dig.
Almost every climate action campaign group or climate policy think-tank worth its salt has produced a list of “10 things to do to save the planet” or similar. Many of these lists contain the instruction to go vegan – or less radically, to reduce meat consumption, or more specifically to reduce consumption of lamb and beef because of the high carbon emissions associated with their farming.
Digging a bit deeper can reveal some interesting results. This issue is very nuanced.
Reading the Meat-eater’s Guide to Climate Change by the EWG (Environmental Working Group) would be one step to find out more. There’s so much information, so many different ways to consider it, and it’s easy to draw the wrong conclusions.
The researchers at EWG who wrote the meat-eater’s guide had to do a substantial research project to get an answer to their questions, involving a massive data gathering exercise to create full lifecycle carbon footprint assessments for 20 popular food protein types.
Analysing the Carbon Footprint of Supply Chains
They covered husbandry practices, pesticide and fertiliser usage, feed types, methane emissions, processing, transportation, cooking, disposal, wastage rates – they pulled in data from research across the world, built huge spreadsheets and even then in answer to a lot of questions, e.g. corn-fed vs grass-fed cows, had to say “more research needed”.
That research was not the final word on the climate impact of people’s food choices in the USA. Research continued, knowledge accumulated, agricultural practice and supply chains changed and still do. The publication from 2011 will be out-of-date now, and the issue will never be fully resolved anyway.
The analysis above is now almost 10 years old, but something telling came to light from a researcher who decided to have a look at their data again. He was unhappy with the way they showed the carbon footprint per kilo of food consumed. It just didn’t make sense to him to compare food that way – no-one consumes the same weight of, for instance, milk and then cheese.
So instead of using the simple food weight, he reworked the data to show the carbon footprint according to the food’s nutritional value for which it is chosen. https://alhufton.com/greenhouse-gas-emissions-for-common-protein-sources/
He showed the carbon footprint per calorie, which makes sense for comparing carbohydrate-rich foods like rice and potatoes. Looking at the emissions per kilo shows that potatoes and rice are equivalent, but actually for the calorie content, rice provides a significantly lower carbon footprint.
He also calculated the emissions per protein content, which makes sense for comparing protein-rich foods like chicken, tofu, nuts or beans. This is the resulting chart, where the blue columns are the food items from the original data in the original order.

Doing it that way, it’s obvious that cheese has the same impact as milk in the context of how we eat. If you have moral reasons for not eating chicken, then this data doesn’t help, but for non-vegans or flexitarians, the low carbon choice includes chicken, which with this data (the light green bars) is actually slightly better than dried beans, milk or eggs.
Food | Kilos of CO2 per kg of food | Kilos of CO2 per unit of energy in food (kcal) | Kilos of CO2 per gram of protein in food |
Turkey | 7.74 | 7.56 | 3.57 |
Tomatoes | 0.78 | 8.01 | 11.68 |
Tofu | 1.42 | 3.36 | 2.07 |
Rice | 1.92 | 2.72 | 9.38 |
Potatoes | 2.06 | 4.09 | 10.84 |
Pork | 8.59 | 5.34 | 4.40 |
Peanut butter | 1.78 | 0.56 | 0.97 |
Nuts | 1.63 | 0.48 | 1.21 |
Milk (2%) | 1.35 | 4.98 | 5.38 |
Lentils | 0.64 | 1.02 | 0.93 |
Lamb | 27.84 | 18.16 | 14.80 |
Eggs | 3.41 | 4.06 | 3.57 |
Dry beans | 1.42 | 2.35 | 3.17 |
Chicken | 4.90 | 3.79 | 2.36 |
Cheese | 9.59 | 4.38 | 5.52 |
Canned Tuna | 4.33 | 6.89 | 2.23 |
Broccoli | 1.42 | 7.49 | 7.85 |
Beef | 19.18 | 14.75 | 10.07 |
Obviously it doesn’t make sense to compare tomatoes or broccoli this way, since no-one eats them for their protein or calorie content, so those high carbon footprints are meaningless.
But does it always have to be this hard to get the most useful information? In our present world, this is the new normal. In the fight against climate change, half of the fight is sorting out the facts from the irrelevant or the outright wrong. Supply chains are notorious for lack of transparency.
In the world of governments and industry stuck in “business-as-usual”, or even if world leaders decided to implement a climate-saving carbon tax and pricing policy to meet their 2015 Paris Agreement targets tomorrow, nothing discussed here would change. Going green would still be hard.
There is another policy and approach to saving the planet though and it would turn this issue on its head.
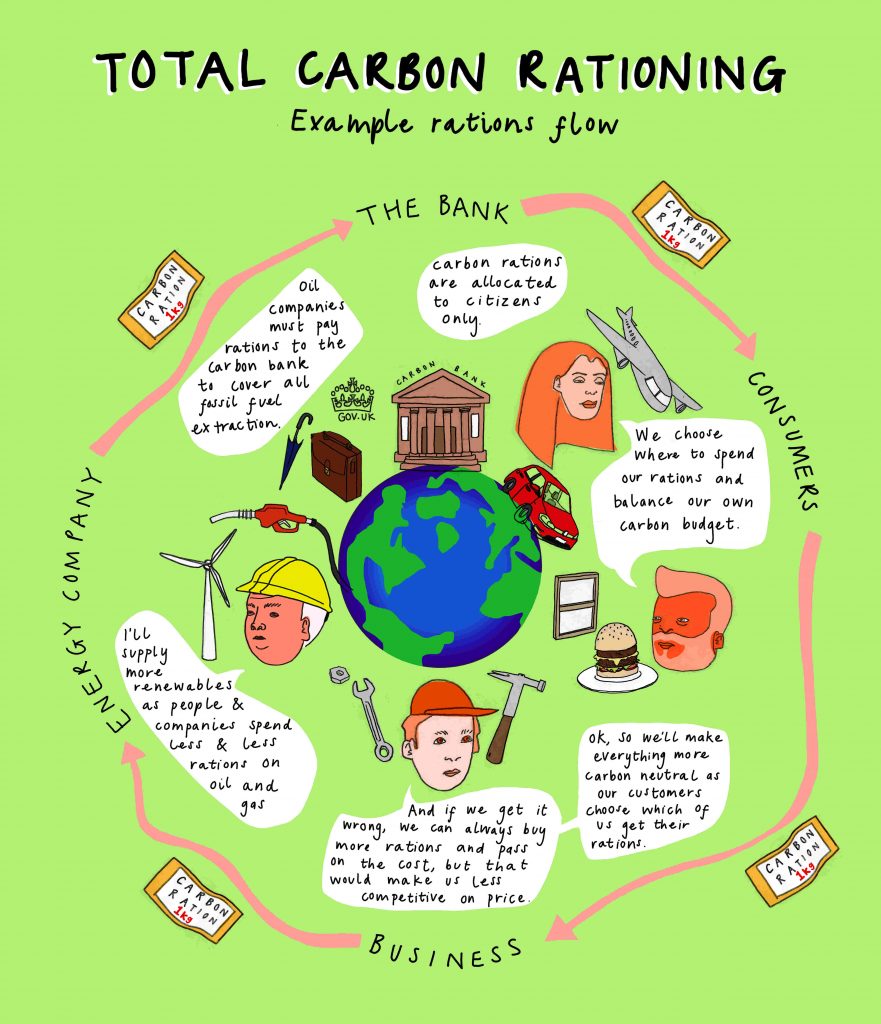
Total Carbon Rationing (TCR) is a policy proposal from Carbon Watchdog for a carbon currency backed by rations. It rations individuals and the whole economy – all the way through business and commerce back to the fossil fuel producers on whom the rationing would be based. One facet of TCR is that the carbon footprint of every product or service is calculated by the person or business selling it.
And that is what would ultimately define the carbon footprint that the consumer (us) sees when we wanted to purchase something. That’s because the carbon rations must pass through the supply chain with every purchase and sale and end up with the fossil fuel companies.
To explain this with an example, imagine that Acme Widgets makes widgets – this is how it works out a carbon ration figure to put on the price tag:
- A fossil fuel producer pumps oil from its oil field and sells it to its customers, charging carbon rations on a weight-for-weight basis, i.e. oil that results in a ton of CO2 requires a ton of carbon rations.
- An energy supplier runs a power station on oil, purchasing the oil from the fossil fuel producer, and paying rations accordingly. It demands these rations from its customers, like Widgebits & Co and Dingbat Corp, proportionate to their energy usage.
- Widgebits & Co gets energy from the energy supplier to make component A and pays the supplier carbon rations, from which it works out that this costs 3 kg carbon ration per component.
- Similarly, Dingbat Corp calculates that it needs 5 kg rations for each component B that it produces.
- The end-producer Acme Widgets sells widgets that it makes from Component A from Widgebits & Co (3 kg ration) and Component B from Dingbat Corp (5 kg).
- Acme Widgets also has to buy diesel from the fossil fuel provider for its delivery lorry which it works out is 0.1 kg ration per widget.
- Acme Widgets does the sums and works out that the carbon ration for each widget is 8.1 kg.
The same flow of carbon rations through an agricultural supply chain would have answered the questions that the EWG tried to answer in their “Meat-eaters’ Guide”, without any huge spreadsheets, and it would have given the best answer straight away, instead of needing smart data analysts to do so much work.
The TCR framework for carbon rationing would cover methane too, not just from the cows and other ruminants, but from anywhere including the by-product of oil production.
TCR also covers forests, peat bogs and other biomes with significant carbon stores. In the agriculture example here, at some point in the future if carbon rations became so expensive – as they will when their supply is approaching zero – then farmers would consider whether it is worth reforesting their land to earn carbon rations on the carbon their new woodland locks up.